
The Generic Mapping Tools
Brief introduction to GMT
GMT or generic mapping tools originated from commandline plotting tools. We used that often in seismology due to its high quality output figures. It could be frustrating to learn at the beginning, but is really rewarding when you finally get through the starting stage.
I used GMT for varies 2D or 3D plots to visualize tomography, seismicity distribution, station distribution, record section etc
The following are from their official website
GMT is an open-source collection of command-line tools for manipulating geographic and Cartesian data sets (including filtering, trend f itting, gridding, projecting, etc.) and producing high-quality illustrations ranging from simple x–y plots via contour maps to artificially illuminated surfaces and 3D perspective views. It supports many map projections and transformations and includes supporting data such as coastlines, rivers, and pol itical boundaries and optionally country polygons. [ Click here for their website! ]
GMT plot
Seismicity Plot in the central Midcontinent

PSXY / GRDIMAGE / PSCOAST / PSBASEMAP
The Central Midcontinent Seismicity
Here is a plot using IRIS seismicity data to plot out seismicity in the central Midcontinent
Large seismicity are marked with brighter red and smaller seismicity are marked as dark red
Outlining the state boundary and lake shore and have topography colored as intuitive elevation color
#! /bin/csh -f

gmtset BASEMAP_TYPE plain TICK_LENGTH -0.15c
gmtset TICK_LENGTH -0.15c
gmtset LABEL_FONT_SIZE 7.8p
gmtset ANOT_FONT_SIZE 7.8p
gmtset ANOT_FONT 4
gmtset LABEL_FONT 4
gmtset FRAME_PEN 0.8p
gmtset ANOT_OFFSET 0.15c
gmtset LABEL_OFFSET 0.01c
gmtset HEADER_FONT_SIZE 10p

set border="-95/-84/32/43"
set WIDTH="8c"
set PEN="1.0p/120/120/120"
set TICKS="a10f5SWen"
set OFN = "Midwest_Seismicity.ps"
set BASIN = TRUE
set BLOCK = TRUE

pwd | psxy -R$border -JM$WIDTH -H -K -P -X3 -Y11 > $OFN
grdcut /data/etopo1.grd -Gtemp.grd -R$border
grdcut /data/etopo1.int -Gtemp.int -R$border
grdimage temp.grd -R$border -JM  -Ctopo_hyxiao.cpt -Itemp.int -K -O -V  >> $OFN
pscoast -JM -R$border -N1/1p -N2/0.25p,grey -W -N3/1p -K -O -V >> $OFN

psscale -Ctopo_hyxiao.cpt -D4/-1/6/0.25h -B100:"Elevation (m)": -P -O -K -V >> $OFN
psbasemap -R -Ba5f1/a2f1wEsN:."Central Midcontinent Seismicity": -JM -K -O -P -V >> $OFN


awk '{if ($6>1 && $4<= -80 && $6<=4) print $4,$3}' seismicity_2018_11_2.txt | psxy -JM -K -O -V -Sc0.1 -R -W2,darkred -Gdarkred >> $OFN
awk '{if ($6>4 && $4<= -80 ) print $4,$3}' seismicity_2018_11_2.txt | psxy -JM -K -O -V -Sc0.1 -R -W2,red -Gred >> $OFN
pwd | psxy -R -JM -H -Ba2f1/a1f1WSne -O >> $OFN

# psbasemap -R$border -B5g5WESN -JM -K -O >> $OFN

rm -f .gmtcommands4
rm -f .gmtdefaults4
ps2pdf $OFN
gs -dSAFER -dBATCH -dNOPAUSE -dEPSCrop -r600 -sDEVICE=pngalpha -sOutputFile=Midwest_Seismicity.png $OFN
GMT plot
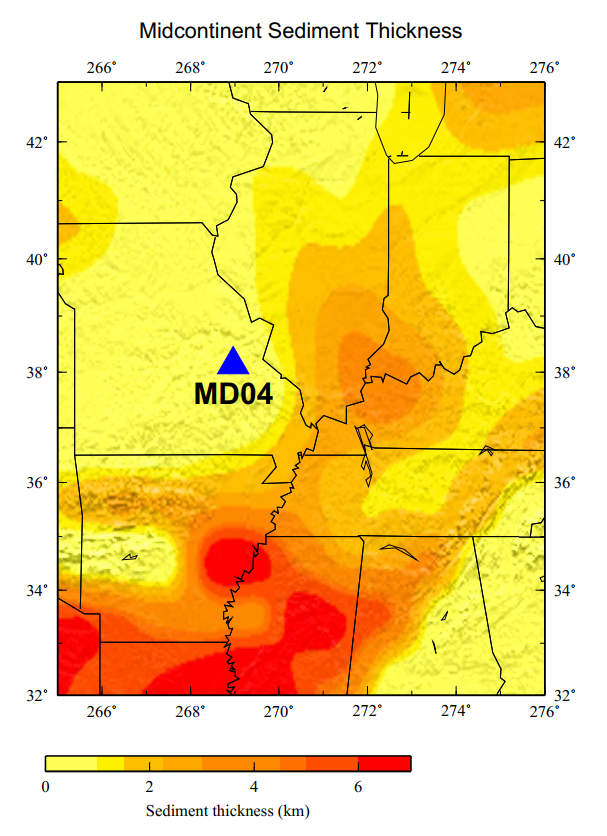
MD04 Seismic Station Location
PSXY / GRDIMAGE / PSCOAST / PSBASEMAP
The MD04 Station on CRUST1.0 Sediment Map
Here is a plot using IRIS station data to plot out seismic station in the central Midcontinent
Basemap was CRUST 1.0 sediment data
Outlining the state boundary and lake shore
  #! /bin/csh -f

  # Input Setting
  # Take input in oder of Name, Latitude, Longitude, Latitude-0.5 ,Output
  # MF10 30 90 29.5 MF10.ps

  set Station_Name = $1
  set Station_Latitude = $2
  set Station_Longitude = $3

  set Station_Longitude_Label = $4  # this is setting the value for Latitude-0.5

  set Output_File_Name = $5


  echo "Station Name: "$Station_Name
  echo "Station Latitude: "$Station_Latitude
  echo "Station Longitude: "$Station_Longitude
  echo "Output File Name: "$Output_File_Name

  # Set up the Paper for plotting

  gmtset BASEMAP_TYPE plain TICK_LENGTH -0.15c
  gmtset LABEL_FONT_SIZE 7.8p
  gmtset ANOT_FONT_SIZE 7.8p
  gmtset ANOT_FONT 4
  gmtset LABEL_FONT 4
  gmtset FRAME_PEN 0.8p
  gmtset ANOT_OFFSET 0.15c
  gmtset LABEL_OFFSET 0.01c
  gmtset HEADER_FONT_SIZE 10p

  # GMT setting plots

  set Border="-95/-84/32/43"  # Midcontinent

  set Width="8"
  set Pen="1.0p/120/120/120"
  set Ticks="a10f5SWen"
  set Basemap="-Ba2f1/a2f1"

  set Input_Filename = "/data/GSA_related/Crust_1_0/crust1.0/sedthk.xyz"
  set Cpt_Filename = "/data/GSA_related/Crust_1_0/crust1.0/sediment.cpt"

  set White_Cpt = "white.cpt"
  echo -10000 255 255 255 10000 255 255 255 > white.cpt

  # Plot out the location of the station

  pwd | psxy -R$Border -JM$Width -H -K -P -X3 -Y10 > $Output_File_Name

  grdcut /data/etopo1.grd -Gtemp.grd -R$Border
  grdcut /data/etopo1.int -Gtemp.int -R$Border

  grdimage temp.grd -R$Border -JM  -C$White_Cpt -Itemp.int -K -O  >> $Output_File_Name

  surface $Input_Filename -I0.05 -R -Gout.grd

  grdview temp.grd -Gout.grd -C$Cpt_Filename -R -JM -Itemp.int -Qi300 -K -O >> $Output_File_Name

  pscoast -R -J -Na/0.25p -W0.1p $Basemap -K -O -P >> $Output_File_Name

  #echo "-90.0688 37.7448" | psxy -JM -K -O -V -St0.6 -R -W2,blue -Gblue >> $Output_File_Name  # print Station Name
  echo $Station_Longitude $Station_Latitude | psxy -JM -K -O -V -St0.6 -R -W2,blue -Gblue >> $Output_File_Name  # print Station Name

  pstext -R -JM$Width -O -N -K -Gblack << END >> $Output_File_Name
  $Station_Longitude $Station_Longitude_Label 14 0 1 CM $Station_Name
  END

  psscale -C$Cpt_Filename -D2.8/-1/6/0.25h -B2:"Sediment thickness (km)": -O -K -V >> $Output_File_Name
  psbasemap -R -B:."Midcontinent Sediment Thickness": -J -K -O -P -V >> $Output_File_Name

  ps2pdf $Output_File_Name
Address
1301 W, Green St., Urbana, U.S.A
Phone
+1779-232-3992
hongyux2@illinois.edu