HPC Tutorials – University of Oklahoma
A structured, step-by-step tutorial series for using High-Performance Computing (HPC) resources at the University of Oklahoma, with a focus on OSCER and DISC.
Workflow Setup on the OU HPC Cluster (Overview)
HPC Tutorial 2024 · University of Oklahoma · Author: Hongyu
An end-to-end overview of working on OU HPC systems, designed for first-time users and researchers transitioning to cluster computing.
Includes a concise quick-start checklist for immediate use.
Linux Command-Line Basics for HPC (Part 0)
HPC Tutorial 2024 · OU OSCER & DISC
Core Linux command-line skills required to work effectively in a shared HPC environment.
Focuses on navigation, file operations, permissions, and process awareness.
Accessing OSCER & DISC Resources (Part 1)
HPC Tutorial 2024 · University of Oklahoma
A practical guide to requesting HPC and GPU access at OU.
Covers account setup, approval workflow, and SSH-based login testing.
HPC Environment Configuration (Part 2)
HPC Tutorial 2024 · OU OSCER & DISC
Guidance on configuring a reproducible and efficient HPC working environment.
Topics include .bashrc, aliases, environment modules,
Slurm basics, Conda, CUDA, and SeisBench.
Data Management on OU HPC Systems (Part 3)
HPC Tutorial 2024 · OU OSCER
Best practices for organizing, transferring, and storing data on shared HPC file systems.
Covers SCP, SFTP, storage locations, quotas, and common pitfalls.
Slurm Job Submission & Monitoring (Part 4)
HPC Tutorial 2024 · University of Oklahoma
A hands-on guide to running, monitoring, and troubleshooting jobs using the Slurm workload manager.
Key commands: sbatch, squeue,
sacct, sstat.
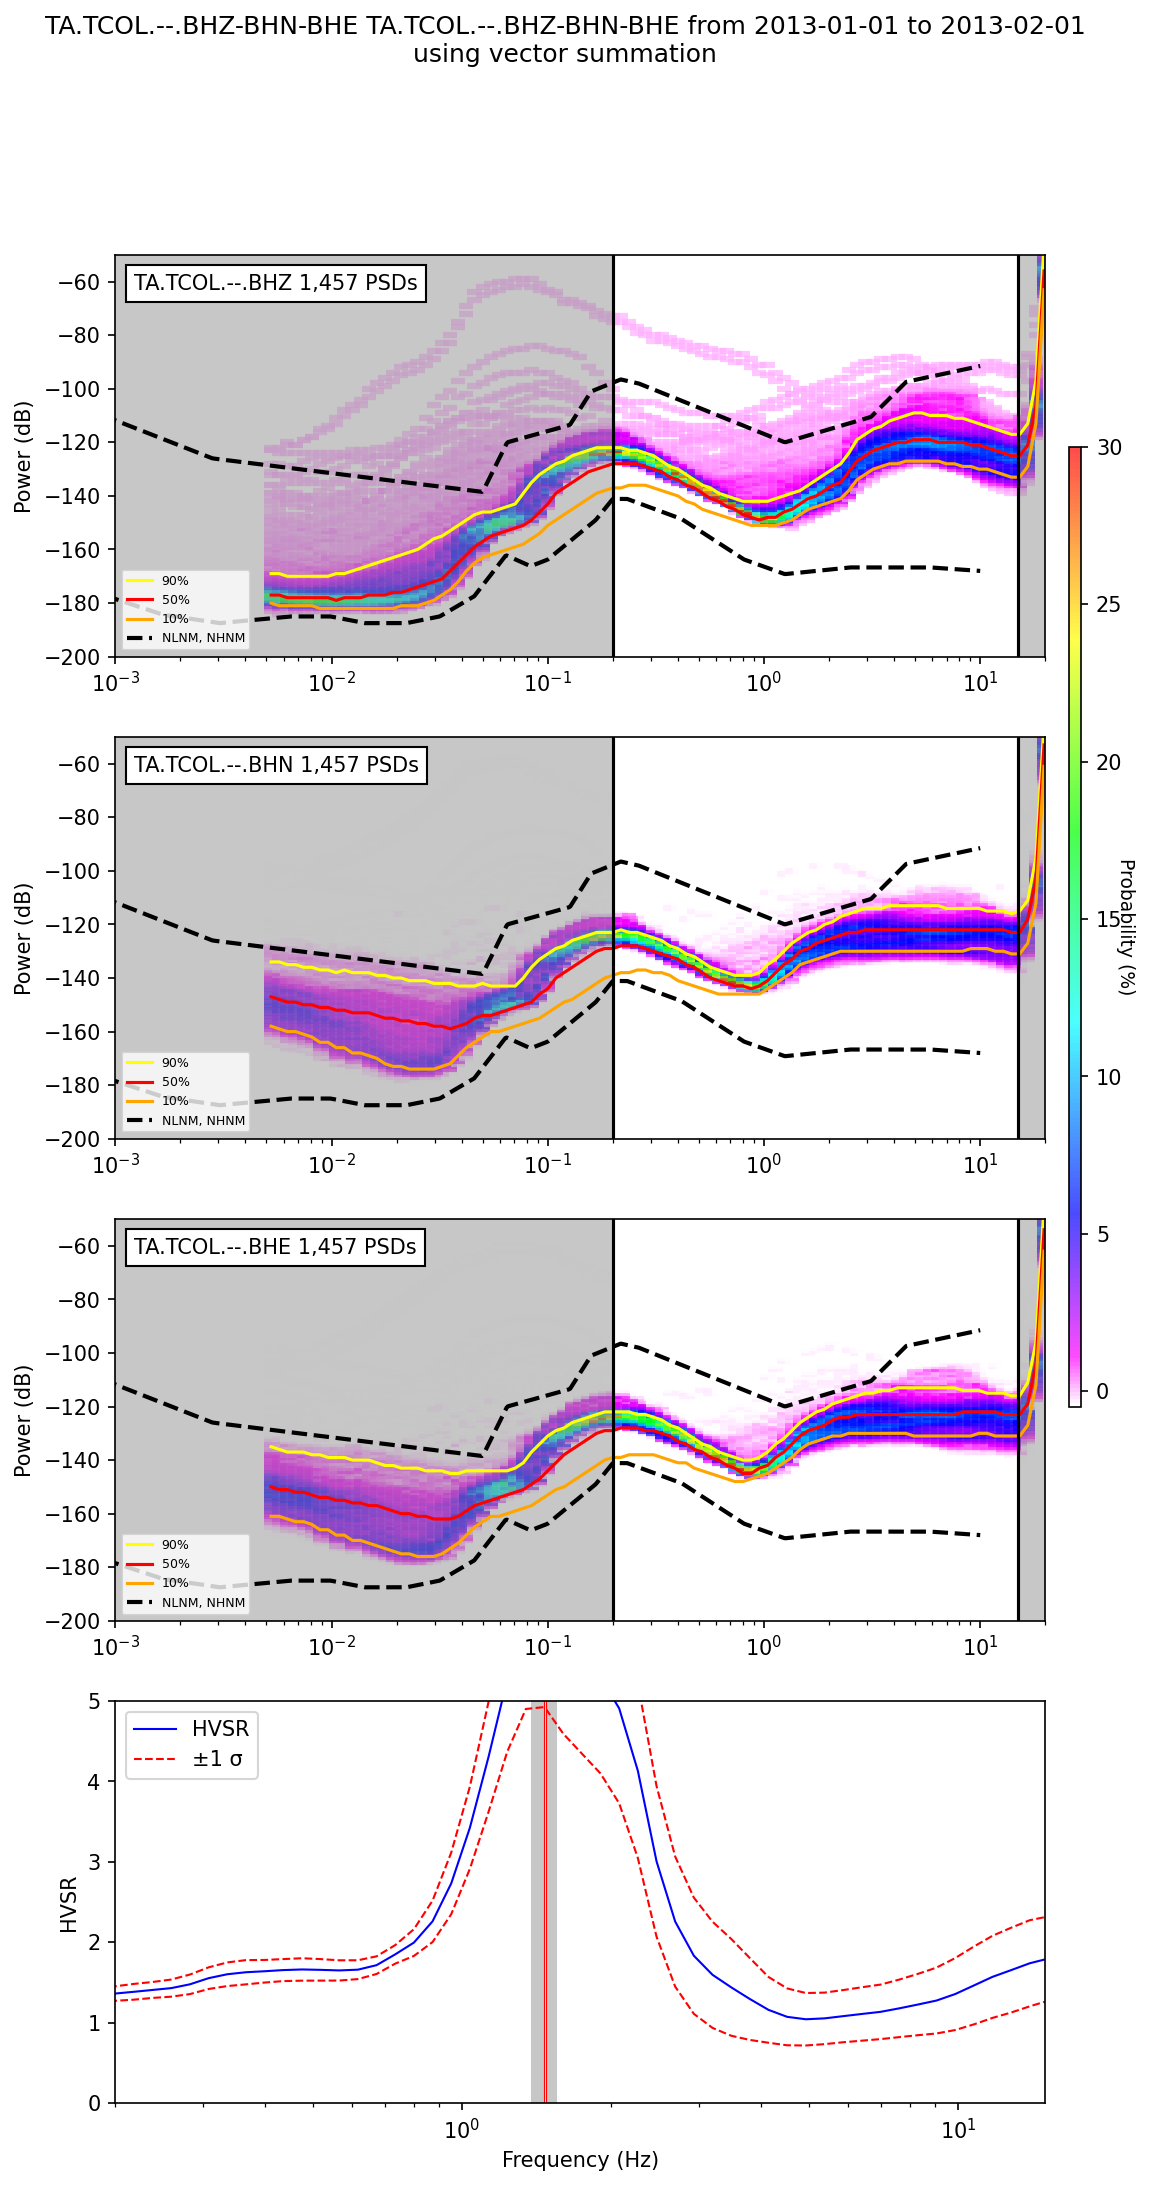
SeisBench Tutorials
Hands-on tutorials for using SeisBench to load, inspect, and visualize seismic datasets for machine-learning-based seismology.
Loading SeisBench Data & Dataset Statistics Visualization
SeisBench Tutorial 2025 · Author: Hongyu
A practical walkthrough for loading SeisBench datasets and performing basic dataset inspection.
Demonstrates how to visualize dataset composition using bar plots to summarize label and class distributions.
Quick start workflow: load a dataset, inspect labels, and generate a bar plot showing sample counts per class.
Research Code Releases
Open-source scientific software projects for seismic data analysis, deep learning, and geophysical research.
SeisBench with Synthetic Seismogram
Open-source Code Release · PyTorch · SeisBench · Author: Hongyu
Project Overview
A comprehensive deep learning framework for seismic phase picking using PyTorch, SeisBench, and synthetic training data. This pipeline provides end-to-end tools for detecting and picking seismic phase arrivals (P and S waves) from three-component seismograms using neural networks.
Key Features
- Synthetic Data Generation: Create realistic 3-component synthetic seismograms with configurable parameters for training datasets
- Data Preprocessing: Standardized conversion to SeisBench format for interoperable workflows and reproducible results
- Deep Learning Models: Train PhaseNet and other neural network architectures for automated phase picking
- Model Evaluation: Comprehensive evaluation toolset for prediction analysis and performance metrics
- Visualization Tools: Advanced plotting utilities for seismogram inspection, model outputs, and results analysis
Technology Stack
Python · PyTorch · SeisBench · NumPy · Matplotlib · ObsPy
Repository & Documentation
View on GitHub: seisbench_with_synthetic_seismogram →
Clone:
git clone git@github.com:Hy-X/seisbench_with_synthetic_seismogram.git
Getting Started
pip install seisbench torch
Visit the GitHub README for detailed installation and usage instructions. See our SeisBench tutorial → for data loading and visualization examples.
Use Cases
- Training phase-picking models with synthetic seismic data
- Benchmarking deep learning architectures for seismic signal detection
- Research in automated seismic event detection and location
- Educational resource for machine learning in geophysics
Oklad Annotation Workflow
Open-source Code Release · Python 3.7+ · Annotation Tools · Author: Hongyu
Project Overview
A comprehensive workflow for annotation tasks using the Oklad model. This repository provides optimized, independent scripts and tools for automated annotation processing, enabling efficient and scalable data annotation pipelines.
Key Features
- Oklad Model Integration: Leverages the Oklad model for high-quality automated annotation processing and semantic understanding
- Modular Script Architecture: Independent, reusable scripts that can be run separately or chained together for flexible workflows
- Batch Processing: Efficient handling of large-scale annotation tasks with optimized performance for production environments
- Data Preprocessing: Built-in tools for data validation, cleaning, and formatting before annotation
- Result Export: Multiple output formats for seamless integration with downstream analysis tools
Technology Stack
Python 3.7+ · Seisbench · NumPy · Pandas · JSON/YAML
Repository & Documentation
View on GitHub: oklad_annotate_workflow →
Clone:
git clone git@github.com:Hy-X/oklad_annotate_workflow.git
Getting Started
Requires Python 3.7 or higher. Clone the repository and follow the setup instructions in the README.
Visit the GitHub README for detailed installation and usage instructions, including example workflows and configuration options.
Use Cases
- Automated large-scale annotation of research datasets
- Semantic analysis and text/data annotation pipelines
- Batch processing of annotation tasks in production environments
- Integration into data preprocessing workflows for machine learning projects
Python
Oklahoma Earthquake Streamgraph
Explore the seismicity trends in the Oklahoma region from 2010 to 2024 using data from the Oklahoma Geological Survey (OGS) seismic catalog. This Python tutorial demonstrates how to create a streamgraph to visualize earthquake data over time. Learn how to work with seismic datasets and generate insightful visualizations for earthquake analysis.
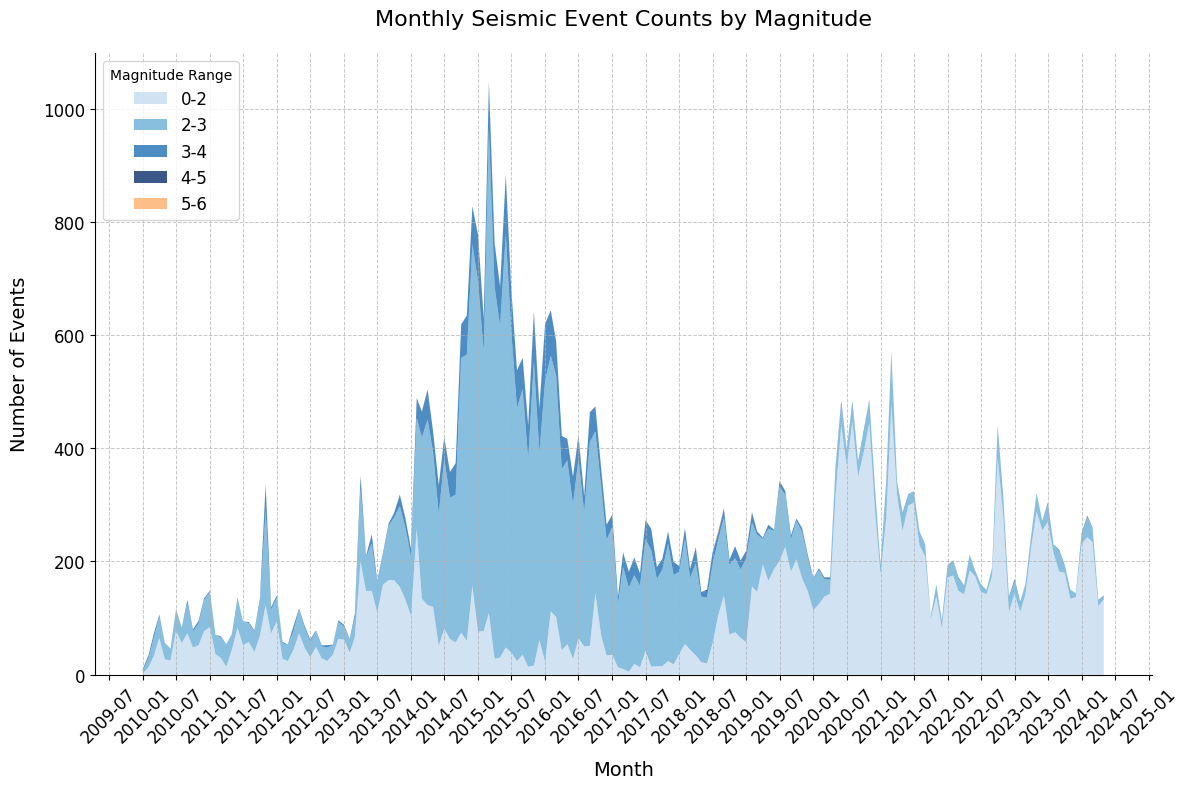
Download the example text file for this example to follow along and recreate the visualizations.
Read CSV file in pandas and make scatter plots
How to read CSV file into pandas ? Here is an example how to load the CSV file and make scatter plots. Examples includes simple scatter plot, scatter plot with symmetric error bars, scatter plot with asymmetric error bars, and plotly scatter plots
CSV file used for this example and this is the Notebook file
Setup Anaconda/jupyter notebook/modules
How to set up an Anaconda environment to use python in earth science ? This is the start of everything before using it. This post shows instructions on installing Anaconda, Jupyter notebook, Pandas and other useful modules
Jupyter Notebook简介和使用入门
什么是Jupyter notebook? 为什么要使用Jupyter Notebook?
如何安装Jupyter Notebook,入门的的安装和调试是怎样的?为什么大家喜欢使用这个平台进行调试?
Numpy 简介和使用入门
什么是Numpy? 为什么要使用Numpy?
如何安装Numpy ,入门是怎样的? 有什么基本的使用方法?